
Book a Free Call
No commitment required
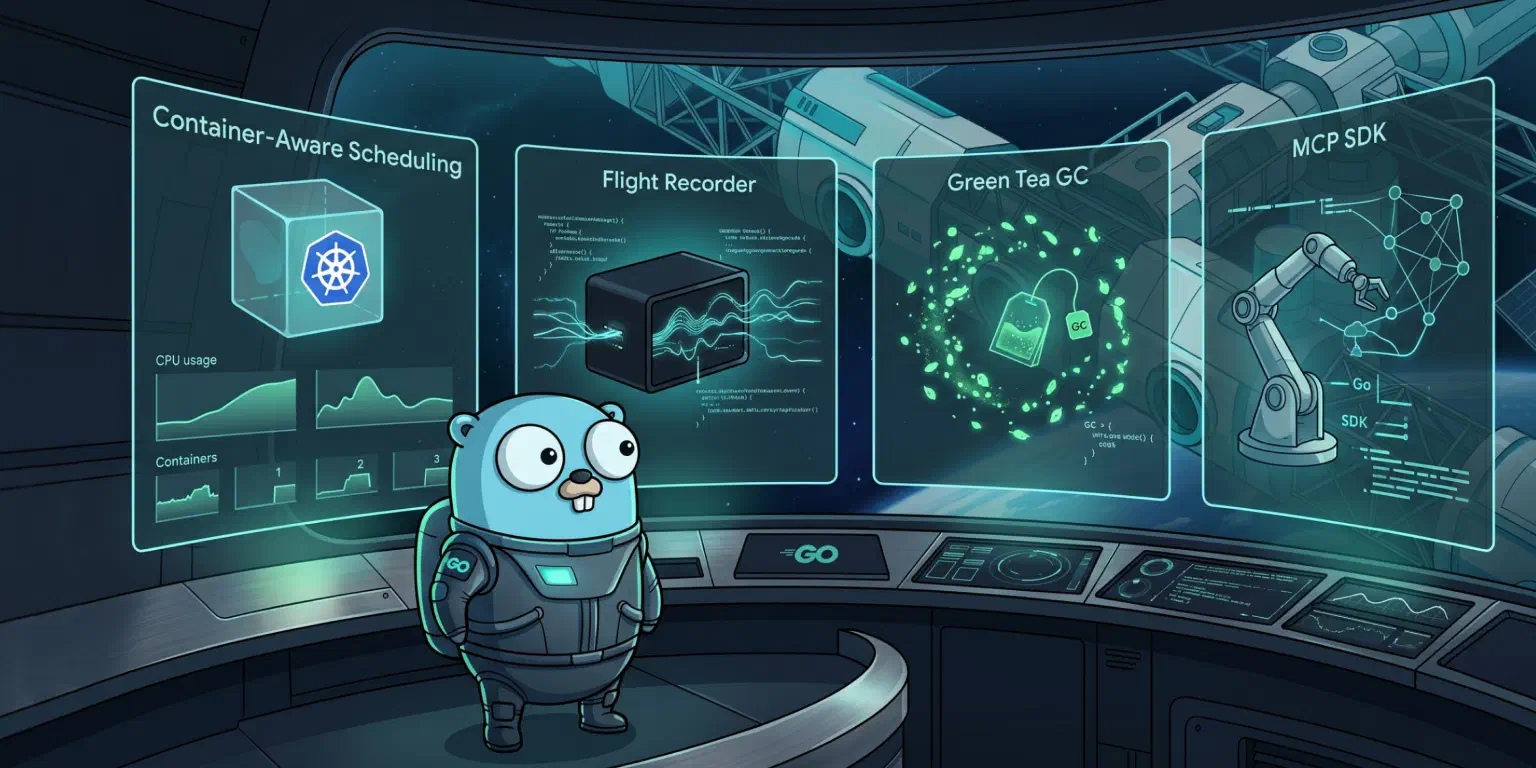
TL;DR: Go 1.25 and 1.26 ship four features that directly impact production metrics. Container-aware GOMAXPROCS eliminates Kubernetes CPU throttling without configuration. The Flight Recorder lets you capture execution traces after an incident happens. The Green Tea garbage collector cuts GC overhead by 10–40%. And the official Go MCP SDK positions Go as the infrastructure layer for AI agent systems.
Every six months, the Go team ships a new release. Most engineering teams scan the release notes, nod at the performance improvements, and schedule the upgrade for “next quarter.” The upgrade rarely happens.
Go 1.25 (August 2025) and Go 1.26 (February 2026) are different. These releases contain features that solve operational problems we see in nearly every production Go deployment we work with: container misconfiguration, invisible latency spikes, post-incident debugging blindness, and rising infrastructure cost. The fixes are automatic or near-automatic. You just have to upgrade.
Here is what matters, with the data behind it.
Before Go 1.25, the runtime set GOMAXPROCS to the number of logical CPUs on the machine, not the container. A pod with a CPU limit of 2 running on a 64-core node would report 64 available CPUs. The Go scheduler would spin up 64 OS threads. The Linux kernel would throttle the pod, often unpredictably, producing p99 latency spikes that were nearly impossible to trace.
This is not a theoretical edge case. When Uber rolled out go.uber.org/automaxprocs to fix this across their fleet, the effect on roughly 1,500 containerized Go services was universally positive.[1] At least at the time, CFS imposed such heavy penalties on Go binaries exceeding their CPU allotment that properly tuning GOMAXPROCS was a significant latency and throughput improvement.[2]
The numbers are stark. In a controlled benchmark on a real Kubernetes cluster—a 2 CPU limit container on a 64-core host handling 1,000 req/s—Michal Drozd measured the following:[3]
| Metric | GOMAXPROCS=64 (default) | GOMAXPROCS=2 (correct) | Improvement |
|---|---|---|---|
| p50 latency | 45 ms | 12 ms | 4x better |
| p99 latency | 890 ms | 35 ms | 25x better |
| Throttle rate | 72% | 3% | 24x reduction |
| Context switches/s | 45,000 | 2,100 | 21x reduction |
The 890 ms tail latency was entirely artificial—caused by CFS throttling pauses, not actual work. The Linux Completely Fair Scheduler enforces CPU limits through a quota mechanism. With a 2 CPU limit, your container gets 200 ms of CPU time every 100 ms period. Once exhausted, the kernel pauses all threads in that container until the next period begins. This coordinated pause hits every in-flight request simultaneously.[3]
The overhead compounds. With 64 threads competing for 2 CPUs, context switching alone can consume 20–30% of the total CPU budget.[3] Each switch requires saving and restoring register state, flushing TLB entries, and potentially invalidating CPU caches. The extra threads do not help you go faster—they actively slow you down.
Go 1.25 makes the fix native. The runtime now reads the cgroup CPU bandwidth limit at startup and periodically checks for changes. If your Kubernetes manifest sets limits.cpu: 2, Go sees 2. No library. No configuration. No throttling from overscheduling.[2]
There are two caveats worth knowing:
GOMAXPROCS via environment variable or code, the new behavior disables itself. Remove those overrides to get the automatic tuning.[2]The business outcome is straightforward: reduced tail latency, fewer “noisy neighbor” incidents, and one less production dependency to maintain.
Execution tracing in Go is powerful but historically impractical for long-running services. Starting a trace captures everything from that moment forward. If a request times out after three days of uptime, you cannot retroactively start tracing the events that caused it.
Go 1.25 introduces the Flight Recorder, a circular buffer that continuously captures execution traces in memory. When your application detects a problem—a slow request, a failed health check, a threshold breach—it can snapshot the last N seconds of trace data and write it to disk or ship it to your observability platform.[4]
Why this matters in dollars: industry data shows 82% of teams now take over an hour to resolve production incidents, up from 74% in 2023. Average incident MTTR across industries is 8.85 business hours. Meanwhile, 91% of SME and large enterprises report hourly downtime costs exceeding $300,000, and 44% say a single hour can cost over $1 million. At $9,000 per minute, every 10 minutes of MTTR improvement saves $90,000 per incident.[5]
The Flight Recorder directly attacks the longest phase of incident response: diagnosis. Teams with full-stack observability are 18% more likely to resolve high-business-impact outages in 30 minutes or less.[5] The Flight Recorder adds a tool those teams did not have before: the power of hindsight.
fr, err := trace.NewFlightRecorder(trace.FlightRecorderOptions{
    MinAge:  10 * time.Second,
    MaxBytes: 50 * 1024 * 1024,
})
if err != nil {
    log.Fatal(err)
}
fr.Start()

// Later, when you detect a problem:
if latency > 100*time.Millisecond {
    f, _ := os.Create("snapshot.trace")
    fr.WriteTo(f)
    f.Close()
}
A 10-second trace from a busy service runs about 10–100 MB. That is small enough to capture, transmit, and analyze without impacting the running process. The Go team reports overhead of roughly 1–2% CPU for continuous tracing—compared to 10–20% with older approaches—making it viable to leave on in production.[4] The go tool trace viewer turns the snapshot into a visual timeline of goroutines, syscalls, and scheduler events.
For teams running SaaS platforms, this changes the post-incident workflow. Instead of reproducing a race condition locally or adding speculative logging and waiting for a recurrence, you capture the exact execution window that produced the failure. Mean time to resolution drops because you are no longer guessing what happened. You are looking at it.
Go 1.25 shipped an experimental garbage collector called Green Tea, available via GOEXPERIMENT=greenteagc. Go 1.26 enables it by default.
The Go team notes it is not uncommon to see Go programs spending 20% or more of their CPU time in the garbage collector. Of that GC time, about 90% is marking and only 10% is sweeping. Of the mark phase, at least 35% is typically stalled waiting on heap memory access. That stalls not just GC work but also the application goroutines that need the CPU.[6]
Green Tea replaces the object-centric mark-and-sweep algorithm with a page-centric design. It scans contiguous memory spans rather than chasing individual pointers across the heap. The result is better cache locality, improved CPU scalability during GC cycles, and fewer memory stalls.
The benchmark data is strong. In the Go team’s own benchmark suite, Green Tea shows a 10–40% reduction in GC CPU costs, with roughly 10% as the modal improvement. In GC-heavy microbenchmarks such as binary-trees and garbage, L1 and L2 cache misses were cut in half. The tile38 geospatial database benchmark saw a 35% reduction in GC overhead.[7]
On newer amd64 CPUs (Intel Ice Lake+, AMD Zen 4+), vector instructions accelerate small-object scanning for an additional ~10% improvement.[6] Real-world testing by Napoleon Wulkan on pointer-heavy backend workloads showed 8–14% end-to-end improvement, while string-heavy parsing workloads saw 3–7%.[8] Criztec reported P99 latency improvements of up to 18% under REST traffic loads.[9]
What this means in production: fewer stop-the-world pauses, more predictable latency, and lower CPU usage under memory pressure. For services that handle bursty traffic or process large datasets, the improvement is not marginal. It is the difference between hitting your SLOs and missing them during peak load.
One operational note: initial benchmarks show an 8–15% increase in baseline RSS due to the collector’s revised memory layout strategy. This is not a leak—it is the cost of the new span organization. Recalibrate your Kubernetes memory limits and HPA thresholds after upgrading, and verify with runtime.ReadMemStats before and after.[9]
The upgrade path is simple. Build with Go 1.26 and you get Green Tea automatically. If you encounter regressions, opt out with GOEXPERIMENT=nogreenteagc at build time and file an issue. The opt-out is expected to disappear in Go 1.27, so testing now is prudent.
The Model Context Protocol (MCP), originally developed by Anthropic and now governed by the Linux Foundation, has become the standard for connecting AI agents to external tools and data sources. Go 1.25 ships with an official mcp package, and Go 1.26 tightens the integration.
The adoption curve is steep. MCP has crossed 97 million monthly SDK downloads, with over 10,000 active public servers and 300+ client applications. RedMonk called it “the fastest-adopted standard” they have ever tracked. In December 2025, Anthropic donated MCP to the Linux Foundation’s Agentic AI Foundation, co-founded with Block and OpenAI and backed by Google, Microsoft, AWS, Cloudflare, and Bloomberg. By early 2026, 28% of Fortune 500 companies had deployed MCP servers in production, and 80% were running active AI agents.[10]
The official Go SDK lives at github.com/modelcontextprotocol/go-sdk. It has 4,463 stars, 110 contributors, and is maintained in collaboration with Google. It implements the full MCP spec across multiple versions, with packages for the core protocol, JSON-RPC transports, and OAuth primitives.[11]
This matters because Go is already the dominant language for infrastructure—Kubernetes, Prometheus, Terraform, Consul, Caddy. Positioning Go as a first-class MCP language means your existing platform team can build AI agent integrations without learning a new stack. When Atlassian ships official MCP servers for Jira and Confluence, when Cloudflare hosts MCP server infrastructure, when AWS integrates MCP into Bedrock agents, the protocol is not experimental. It is the plumbing layer for AI-native applications.
If your product roadmap includes AI features—agentic support bots, autonomous operations tooling, or LLM-augmented analytics—having Go as a native MCP implementation language reduces integration risk and lets your backend engineers own the full stack.
runtime.ReadMemStats.automaxprocs. If you are using the Uber library, delete it. The runtime handles container limits natively now.GOMAXPROCS settings. Search your codebase and deployment configs for explicit GOMAXPROCS overrides. Remove them unless you have a specific reason to keep them.encoding/json/v2. Still experimental, but decoding is substantially faster. If JSON parsing is on your hot path, benchmark it behind GOEXPERIMENT=jsonv2.Go releases are usually conservative. The language changes slowly by design. But the runtime and toolchain have been accelerating, and 1.25/1.26 represent the biggest operational upgrade since generics.
Container-aware scheduling fixes a hidden latency problem that affects nearly every Kubernetes deployment. The benchmark data is unambiguous: a 25x improvement in p99 latency and a 24x reduction in throttling simply by letting the runtime read the cgroup limit.
The Flight Recorder gives you forensic visibility you did not have before. In a world where 82% of teams spend over an hour on incident resolution and hourly downtime can exceed $1 million, cutting diagnosis time is not a nice-to-have. It is a financial imperative.
The Green Tea GC reclaims CPU cycles without code changes. For workloads already spending 20% of their time in GC, a 10–40% reduction in that overhead translates directly to lower cloud bills and tighter latency distributions.
Together, they make the case for upgrading from “nice to have” to “should have done it last month.”
At Wawandco, we manage production Go systems for SaaS companies at scale. The teams that upgrade quickly and validate aggressively are the ones that spend next quarter building features instead of chasing latency regressions. If you need help benchmarking the impact on your workload, we are happy to talk.
Michael Pratt et al., “runtime: CPU limit-aware GOMAXPROCS default,” Go Issue #73193. https://github.com/golang/go/issues/73193
The Go Blog, “Container-aware GOMAXPROCS,” August 2025. https://go.dev/blog/container-aware-gomaxprocs
Michal Drozd, “Go GOMAXPROCS in Containers: The CPU Detection Problem,” November 2024. https://www.michal-drozd.com/en/blog/go-gomaxprocs-containers/
The Go Blog, “Flight Recorder in Go 1.25,” August 2025. https://go.dev/blog/flight-recorder
FlareWarden, “MTTR Explained: What Mean Time to Recovery Actually Measures,” 2024. https://flarewarden.com/insights/mttr-mean-time-to-recovery
The Go Blog, “The Green Tea Garbage Collector,” August 2025. https://go.dev/blog/greenteagc
Austin Clements et al., “runtime: green tea garbage collector,” Go Issue #73581. https://github.com/golang/go/issues/73581
Napoleon Wulkan, “Measuring Go 1.26’s Green Tea GC in the Real World,” February 2026. https://blog.wulkan.xyz/blog/go-1-26-green-tea-gc
Criztec Technologies, “Go 1.26 Runtime Performance: Benchmarking Green Tea GC and Cgo Latency,” February 2026. https://criztec.com/go-1-26-runtime-performance-benchmarking-green-tea-xatp
Deepak Gupta Research, “Model Context Protocol (MCP): Enterprise Adoption, Market Trends & Implementation,” 2025. https://guptadeepak.com/research/mcp-enterprise-guide-2025/
modelcontextprotocol/go-sdk, GitHub repository. https://github.com/modelcontextprotocol/go-sdk