
Book a Free Call
No commitment required
Modern software systems don’t fail due to a lack of data; they fail because teams collect too much of the wrong data, too early.
In many organizations, monitoring and observability are treated as a default checkbox, leading to a heavy, expensive stack running alongside systems still seeking product-market fit. The result is “observability bloat”—unnecessary operational overhead that distracts teams from truly understanding their systems.
At Wawandco, we approach monitoring through the lens of system stewardship. The goal is not to maximize visibility at all costs, but to introduce just enough signal to support confident decision-making at each phase of a product’s lifecycle. Lean monitoring focuses on infrastructure health, resource pressure, and critical failure signals, especially when teams are small and systems are evolving quickly.
This article explores that approach using Beszel, a lightweight, self-hosted monitoring tool designed to provide immediate, low-overhead visibility. Beszel fits perfectly into the early and growth stages of a system’s lifecycle, where speed, simplicity, and clarity matter more than exhaustive instrumentation.
We’ll look at how monitoring strategies should evolve, how to deploy a lean monitoring setup in minutes, and how to recognize when a system is ready to graduate to more advanced observability tooling.
Every product moves through distinct “Edges” where your tooling must match your trajectory to avoid unnecessary friction. If you’re a small team building an MVP, spending a week configuring complex dashboards is a distraction; your goal is product-market fit, not a “best-in-show” heap graph.
Monitoring should be aligned with the Product Lifecycle. By respecting these stages, you ensure that your stack evolves alongside your product, providing the right signal without draining your team’s most valuable resource: focus.
At this stage, your only priority is raw velocity. You need a “heartbeat” to know two things: Is the service running? and Is the server about to crash?
You have active users. Downtime now has a tangible cost, and you’ve likely moved to a containerized setup. Now, seeing how your app interacts with the OS—and spotting “noisy neighbor” containers—is vital.
This is the graduation point. Your infrastructure is a web of multiple services and dependencies, and you need to track business-specific metrics like “API latency by region.”
As Charity Majors notes, a typical rule of thumb is that observability consumes roughly 15–25% of total infrastructure spend.
That’s a useful benchmark—but only once your systems have reached the stage where that level of investment actually creates signal, not noise.
Although we believe in Polyglot Tooling, we often gravitate toward tools that mirror the design philosophy of the languages we love. For Go developers, this means favoring simplicity, efficiency, and minimalism. Beszel is exactly that for the Go ecosystem. It’s a lightweight, self-hosted monitoring solution that trades the sprawling complexity of traditional stacks for a lean, “Go-native” architecture.
Beszel splits the monitoring responsibilities into two minimalist components, ensuring your production environment remains uncluttered:
This tool reflects a minimalist design philosophy, with single-binary deployment, low runtime overhead, and Docker-first visibility through automatic container discovery. With SSH-based security and built-in OIDC support, it integrates cleanly into existing environments without introducing a heavy new ecosystem.
The true strength of a lean monitoring tool like Beszel is that it doesn’t require a weekend of configuration or a specialized DevOps certificate. You can have a production-ready dashboard running in the time it takes to brew a cup of coffee.
The Hub is your central mission control. Since it’s built on Go and PocketBase, it’s exceptionally resource-efficient. We recommend deploying it on a management instance using Docker Compose:
# docker-compose.yml
services:
  beszel:
    image: henrygd/beszel:latest
    container_name: beszel
    restart: unless-stopped
    ports:
      - 8090:8090
    volumes:
      - ./beszel_data:/beszel_data
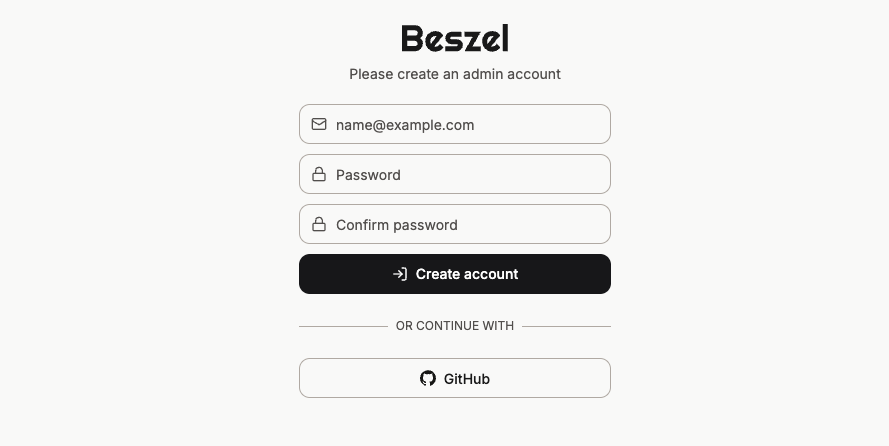
Once you run docker compose up -d, navigate to http://localhost:8090. You’ll be prompted to create an admin account. This is where you’ll manage your fleet.
The beauty of this setup is that it requires zero changes to your application code. You aren’t polluting your business logic with monitoring decorators or custom SDKs. You have two main paths to connect a new system:
KEY used to authenticate the connection between your server and the Hub./settings/tokens). This allows you to spin up new agents dynamically without manually registering them in the UI first.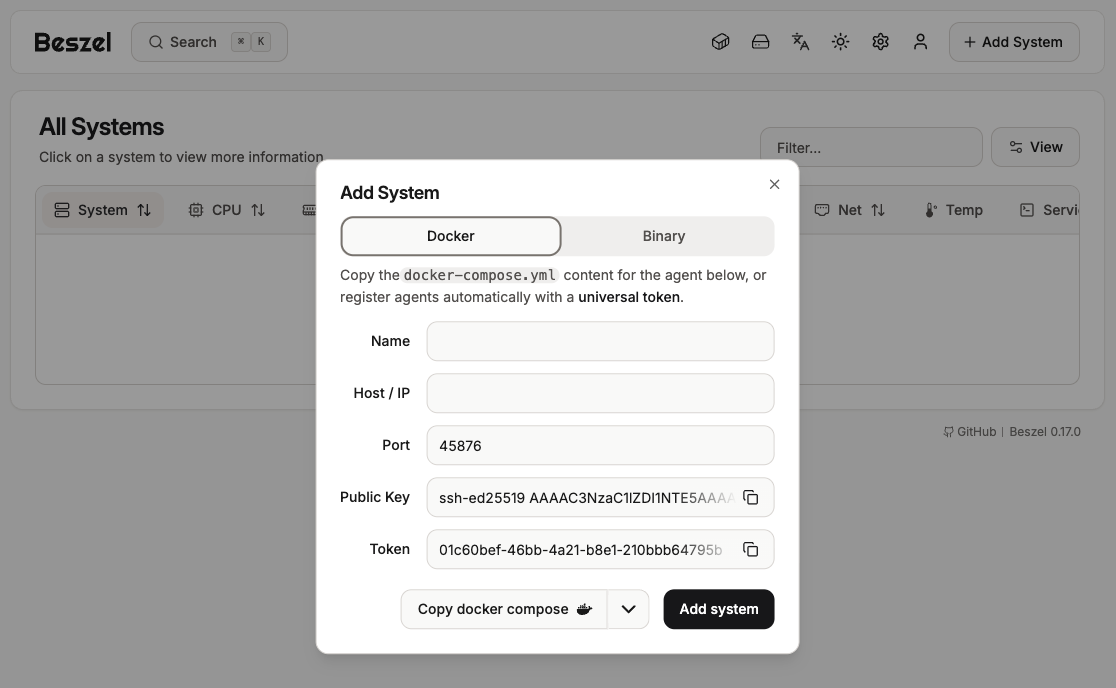
If your apps are running in Docker, the Beszel agent acts as a lightweight steward. By mounting the Docker socket, it automatically discovers your containers and starts graphing their specific footprint without any manual labeling.
# docker-compose.yml
services:
  beszel-agent:
    image: henrygd/beszel-agent:latest
    container_name: beszel-agent
    restart: unless-stopped
    network_mode: host # Required for host network stats
    volumes:
      - /var/run/docker.sock:/var/run/docker.sock:ro
      - ./beszel_agent_data:/var/lib/beszel-agent
    environment:
      PORT: 45876
      KEY: "ssh-ed25519 AAAAC3..." # Your Public Key from Step 2
Note: We use
network_mode: hostto allow the agent to access the host’s network interface stats directly. If you are running the Hub and Agent on the same machine, the guide recommends using a Unix socket instead oflocalhostto bridge the container networks efficiently.
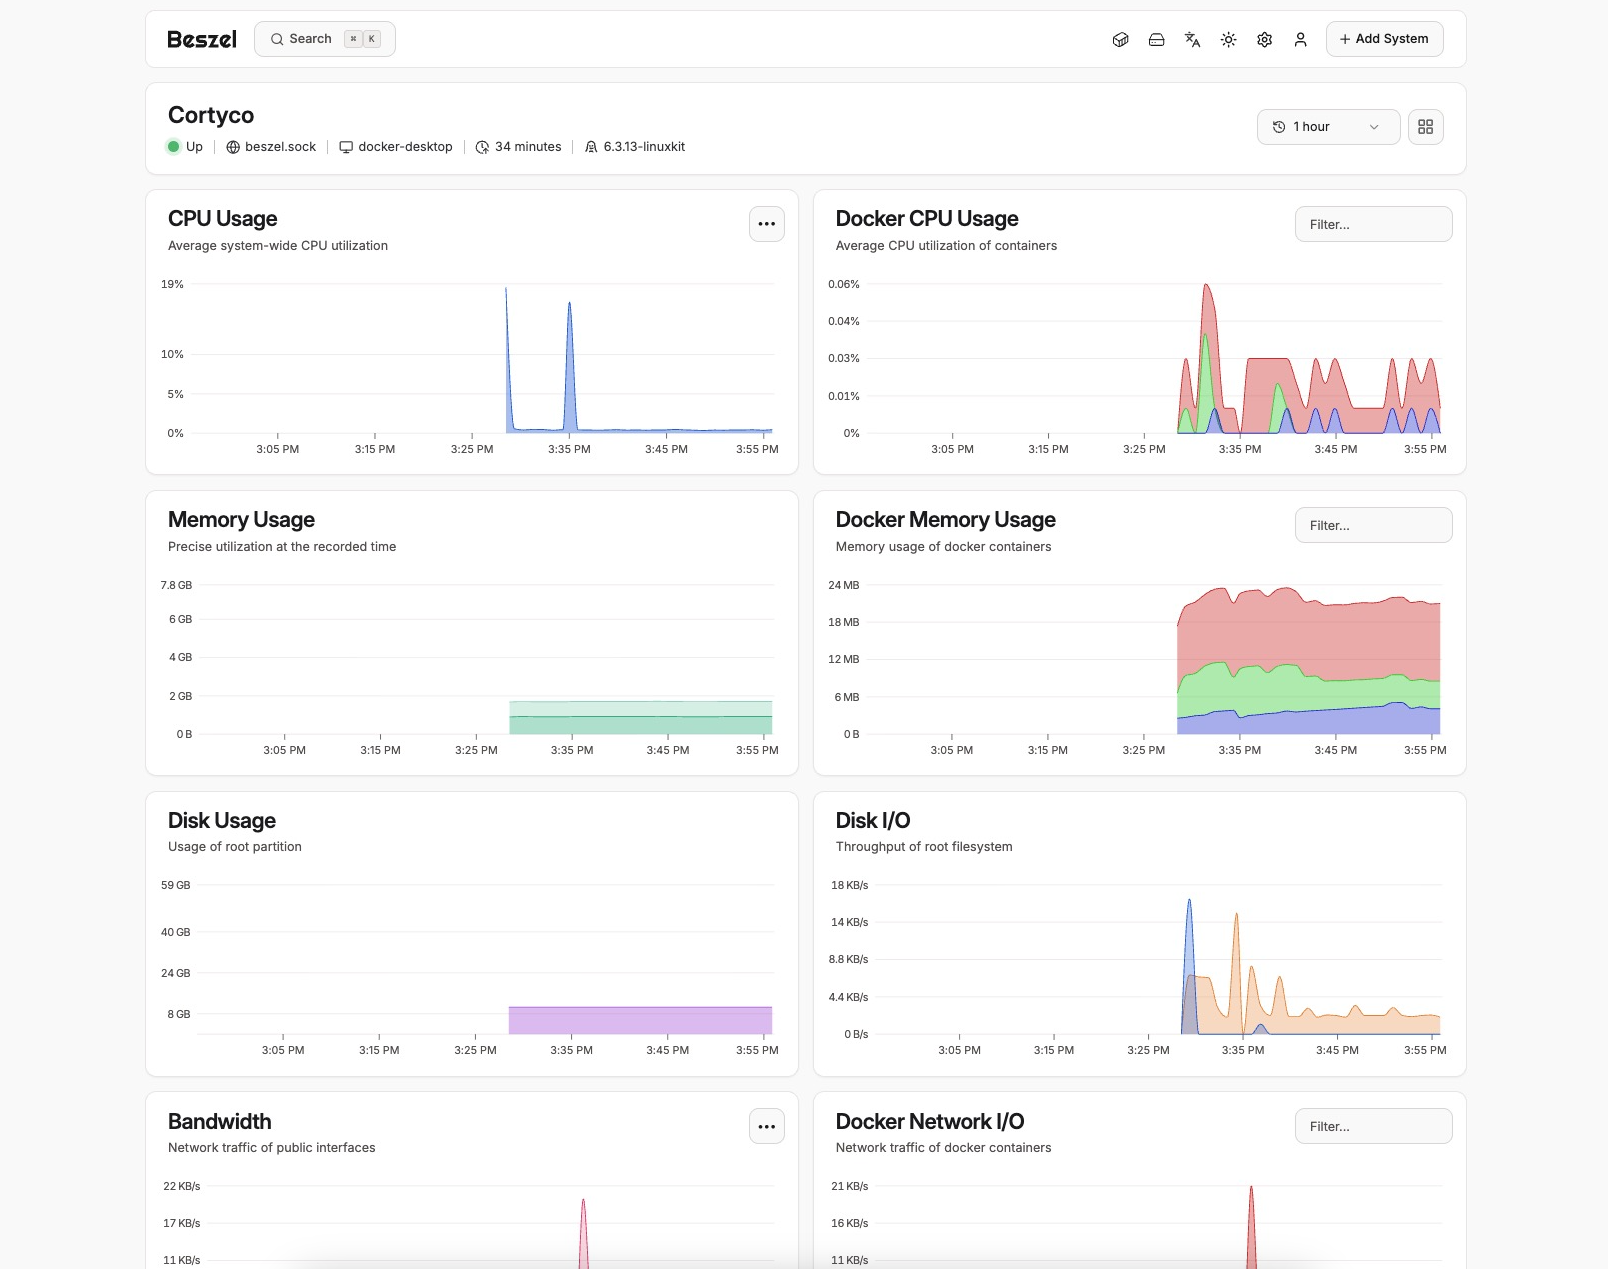
Within seconds of starting the agent, your dashboard will light up. You’ll see:
In early production, the most common and pragmatic setup looks like this:
This works because Beszel is agent-push, not hub-pull. The production server does not expose metrics. The agent establishes an outbound connection to the Hub and streams data over it.
From the Hub’s perspective, there is no difference between a laptop, a VPS, or a management node. Where the Hub runs is an operational decision, not a technical constraint.
When you open the Beszel dashboard and see CPU spikes or container memory growth, you are not looking at cached logs or sampled data.
You are seeing:
There is no staging mirror. There is no synthetic traffic. If production is under load, you will see it immediately.
Beszel is a lean monitoring layer, not a full observability stack. It works best when:
Common scenarios include MVPs, internal tools, and early customer deployments. At this stage, the goal is understanding, not compliance.
As the system matures:
No re-instrumentation, no data migration, and no application changes. The monitoring layer evolves independently, when the system demands it.
Engineering excellence isn’t measured by the number of dashboards you have; it’s measured by your ability to understand and maintain your system efficiently.
For many engineers, especially those in the “Discovery” and “Growth” phases, a lean monitoring stack built with tools like Beszel offers the best ROI. It respects your server’s resources, preserves your team’s focus, and provides a clear window into the health of your infrastructure without the burden of Observability Overkill.
By automating your deployment and hardening your security early, you turn your infrastructure into a silent partner that supports your growth rather than a bottleneck that demands your constant attention.